Building an IoT Edge Application with macchina.io and Docker (Part 2)
Welcome back to the second and final part of my article where I describe how I’ve built a simple edge computing application by combining macchina.io EDGE and macchina.io Remote Manager with InfluxDB, a widely used time-series database, with everything running in Docker containers that can be managed via Portainer.
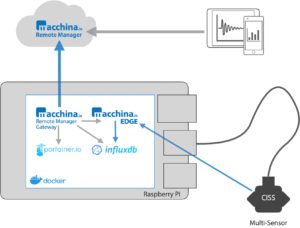
macchina.io Edge Computing Demo Setup
In the first part, I described how I’ve set up the basic system to work on a Raspberry Pi 4 (with Raspberry Pi OS Lite 64-bit). The basic setup has all the applications running in Docker containers, and already provides secure remote access to them via macchina.io Remote Manager.
In this second part, I will show how to write a small JavaScript program that reads sensor data (temperature, humidity, light, acceleration) from a USB-connected multi-sensor device (Bosch CISS), and write that data to an InfluxDB database. I will then use InfluxDB 2’s graphing and dashboard features to build a simple dashboard showing the sensor data. While this is by no means a full-fledged IoT edge computing application, it nevertheless demonstrates the first steps to build one. Typically the first step when building such an application is to collect “interesting” sensor (and other) data from a number of sensors or other sources, and put these values into a time series database, to see how the data looks like and changes over time. From that, further steps, like developing algorithms for analyzing the data, can be taken.
Connecting the Sensor
I have already briefly mentioned in the first part that the Bosch CISS multi-sensor device I’m using is connected to the Raspberry Pi by USB. The actual communication with the sensor happens over a “virtual” serial port over the USB connection, so from a programming perspective the device looks like it’s connected with a good old RS-232 cable. macchina.io EDGE already ships with a plug-in (macchina.io CISS Sensors bundle) that implements the communication with the multi-sensor device, and which also exposes all the sensors through the sensors and devices API provided by macchina.io EDGE. So all I have to do is:
- Connect the Bosch CISS multi-sensor to one of the Raspberry Pi’s USB ports.
- Verify that the device shows up as a new serial device in
/dev, as/dev/ttyACM0. - Expose the
/dev/ttyACM0device to the macchina.io EDGE Docker container. - Configure macchina.io EDGE so that it enables the device.
When exposing device files to a Docker container, you may want to make sure that the device file always has the same name. This can be handled in Linux by defining udev rules. Also, the device must be connected while the container is running. If a device file exposed to the container is not available, the container will fail to start. In typical industrial settings, devices are not randomly connected and disconnected, so in practice this is not a major concern. Instead of exposing only specific device files to a container, it is also possible to start a Docker container in privileged mode, which gives the application running in it access to the entire /dev filesystem. However, from a security perspective, running containers in privileged mode is not advisable.
The docker-compose.yml file in the GitHub repository for this article has the settings for exposing the USB device commented out. So the first step in making the sensor accessible to macchina.io EDGE is to uncomment the respective lines in the docker-compose.yml file:
# Note: uncomment (and modify) devices as required.
# The container will fail to start if any specified
# device is not available.
devices:
  - "/dev/ttyACM0:/dev/ttyACM0"
After uncommenting the two lines, restart the containers with:
$ docker-compose down
$ docker-compose up -d
The above two commands must be executed in the directory where the docker-compose.yml file is located.
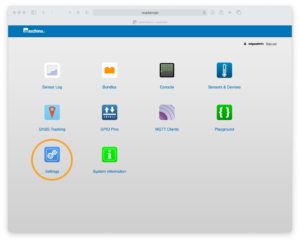
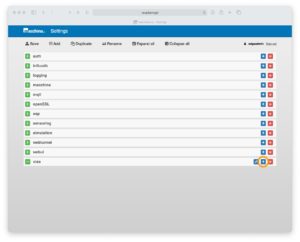
Next I’m going to enable the device in macchina.io EDGE. In order to do that, a configuration property must be defined, and the CISS bundle must be restarted. This is done by logging in to the macchina.io EDGE web user interface, available on port 22080 of the Raspberry Pi (or via macchina.io Remote Manager). The default username and password is edgeadmin. After logging in, launch the Settings app by clicking its icon.
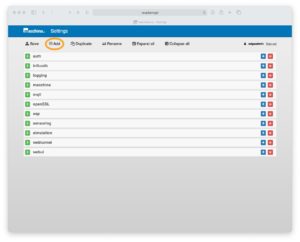
In the Settings app, click the [+] Add button to add a new setting.
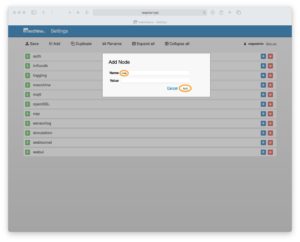
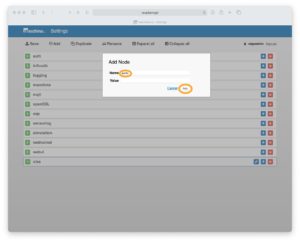
In the Add dialog, under Name enter ciss, leave Value empty, and press enter or click Add.
You will then see a new row for the ciss property. On the property, click the [+] button to add another property under it.
Under Name enter ports, leave Value empty again, and press enter or click Add.
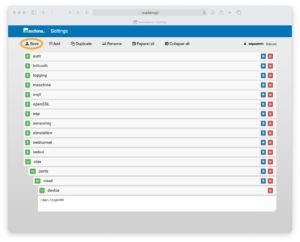
Next, add another setting under ports with Name ciss0, leave Value empty, and then add another setting named device. This time, for Value enter /dev/ttyACM0. The final settings should then look like shown below. Don’t forget to click Save to commit the changes.
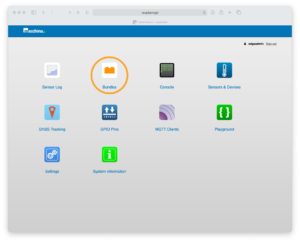
Next, return to the Launcher page by clicking the macchina.io logo in the header. The CISS bundle must be restarted in order to apply the configuration changes and make the device available. This is done from the Bundles app.
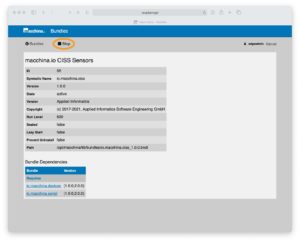
In the list of bundles, locate the bundle named macchina.io CISS Sensors (scroll down, or use the Browser’s search function) and click the name.
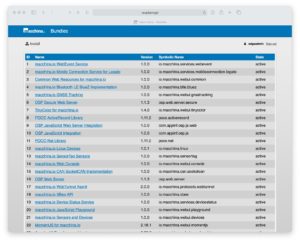
On the bundle’s page, click Stop. After new menu items for a stopped bundle appear, click Start. The CISS bundle will start again and use the updated configuration settings to connect to the CISS multi-sensor device.
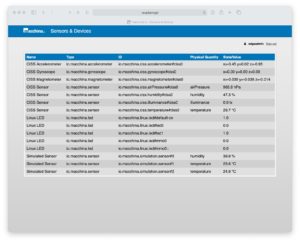
To verify that the CISS sensors are now available, go back to the Launcher screen, by clicking the macchina.io logo in the header, then go to the Sensors & Devices app.
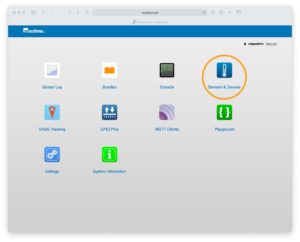
The sensors in the CISS multi-sensor device and their current values should now be visible, along with some other sensors default-enabled in macchina.io EDGE.
Connecting to InfluxDB
With the sensor data available in macchina.io EDGE, now it’s time to get the data into InfluxDB. InfluxDB provides a relatively simple HTTP-based protocol for writing sensor data measurements into a database. This protocol can easily be implemented in a few tens of lines of JavaScript, using the built-in HTTP client feature in macchina.io EDGE.
The full program can be found in a Gist on GitHub, and I won’t replicate it here. It consists of three parts. In the first part, the InfluxDB protocol is implemented, using the built-in HTTP client. Most of the code there deals with properly formatting the measurement data for InfluxDB.
The second part discovers the available sensor services, looking for generic temperature, humidity and illumination sensors, as well as an accelerometer. To keep the program simple, the program takes the first one of each of the available sensors found. A “real” program would be more stringent here and use more specific search queries for finding the sensors.
Finally, the third part sets up two timers to periodically read the sensor values, and write them to InfluxDB. Temperature, humidity and illumination values are read at longer intervals (10 seconds), and all three values are written as a single measurement named environmental.
Acceleration values are read with a higher rate (50 times per second). Measurements are first collected in an array and after 100 measurements have been obtained, all 100 measurements are written in a single POST request to InfluxDB. This reduces the overhead associated with HTTP requests, and is a good idea for higher-rate measurements to reduce overall system load. On a Raspberry Pi 4, reading 50 measurements per second and writing them to InfluxDB every 5 seconds hardly stresses the CPU at all (CPU load stays in the range from 2-5 %), so even much higher-rate measurements of the acceleration values are possible. I briefly tested a 500 Hz sample rate, writing to InfluxDB once a second (therefore, 500 measurements per POST request), and CPU load stayed well below 15 %. However, one factor to keep in mind on the Raspberry Pi is the SD card. SD cards not only have limited amount of space (at least compared to solid state disks, or good old hard disks), but also a have limited number of write cycles. So writing high-rate sensor data to an SD card could damage the SD card, if done over a longer period. To which extent this is an issue also depends on the particular model of SD card – some handle this better than others, and there are also industrial-grade SD cards that can take a lot of abuse.
To run the JavaScript program in macchina.io EDGE, open the Playground app and copy the code into the code editor.
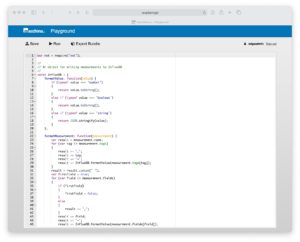
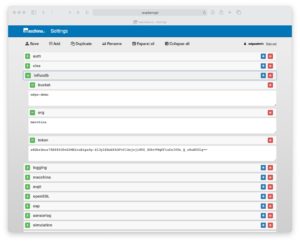
Before running the JavaScript program (by clicking the Run button), a few more configuration settings must be defined, as these will be used by the program to obtain the credentials for connecting to InfluxDB.
The three required settings are the name of the InfluxDB bucket, influxdb.bucket (edge-demo), the InfluxDB organization name influxdb.org (macchina) and the authentication token influxdb.token. The values for the first two settings can be obtained from the initial InfluxDB configuration in the docker-compose.yml file. The token can be obtained by logging in to InfluxDB (initial username and password are in the docker-compose.yml file), going to Data, then selecting the Tokens tab, and clicking on macchina’s Token.
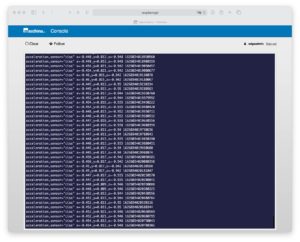
When running, the JavaScript program will write some log entries. These can be viewed in the Console app.
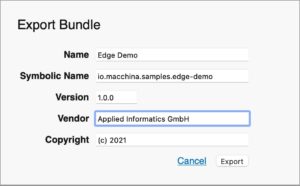
A script run directly from the Playground up will not be restarted automatically when macchina.io EDGE restarts. To fix this, it’s possible to export the script as a bundle, and to deploy that bundle to the macchina.io EDGE instance. This is done by clicking the Export Bundle button in the Playground. In the dialog that appears, enter suitable values (as shown below) and click the Export button. The bundle file will be downloaded to your browser’s Downloads folder.
Don’t forget to stop the Playground script by clicking on the Stop button (otherwise you would have the same program running twice after the next step) and go to the Bundles app. In the Bundles app, click the Install button, then drag and drop the just downloaded bundle file into the drop area to upload and install it. Alternatively, you can also click the drop area to show a file browser dialog to select the bundle file. After installing the bundle, click the Start button to run it.
Creating a Dashboard
The final task now is to create a dashboard showing the stored sensor values. This can be done using the graphing and dashboard features available directly in InfluxDB 2. Alternatively, it would also be possible to install an additional container running Grafana, which provides even more extensive graphing and dashboard features.
I won’t go much into the detail of how to create a dashboard in InfluxDB. There’s plenty of documentation available, and even without reading the documentation, I was able to quickly come up with dashboard shown below by playing around in the InfluxDB web application.
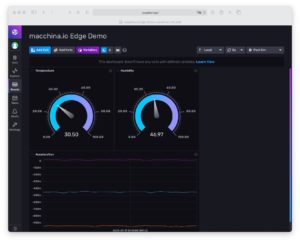
A simple sensor data dashboard built with InfluxDB 2.
Another possibility that InfluxDB provides is monitoring the resource usage (CPU, memory, used space on SD card, etc.). This can be done by installing and running Telegraf, an agent that collects system metrics for InfluxDB, directly on Raspberry Pi OS (not in a container).
This completes the two part series about building an IoT edge computing application with macchina.io EDGE, macchina.io Remote Manager, InfluxDB and Portainer. I have shown how to set Docker on a Raspberry Pi, set up the containers with Docker Compose, connect a multi-sensor device to macchina.io EDGE and write the sensor values to an InfluxDB time-series database. An important aspect of this demo is that with macchina.io Remote Manager, all web apps provided by the different applications can be accessed remotely, even if the Raspberry Pi would be located in a different network. Furthermore, I have only shown the features available in macchina.io EDGE out of the box (in the provided Docker image). macchina.io EDGE is highly customizable and provides very comprehensive APIs for building much more sophisticated edge applications by combining C++ and JavaScript.
A final word on memory usage. Total memory usage is about 320 MB RAM on the Raspberry Pi, with the majority (approx. 100 MB) used by InfluxDB. macchina.io EDGE uses less than 40 MB (with most of the memory actually used by the JavaScript engine), and the Remote Manager Gateway container about 4 MB. So, in practice, a container-based approach seems feasible with device with at least 512 GB of RAM. With macchina.io EDGE running standalone and without JavaScript support, memory usage even goes down below 16 MB, making it a great platform even for smaller Linux-based devices.
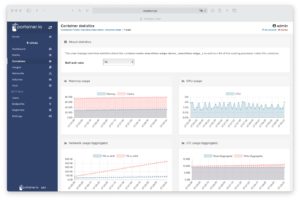
Monitoring macchina.io EDGE resource usage with Portainer